ΑΝΟΔΙΚΕΣ – ΠΤΩΤΙΚΕΣ: 46 – 62 (ΧΘΕΣ: 66 – 42)
- ΑΞΙΑ ΣΥΝΑΛΛΑΓΩΝ: 75,06 εκατ.
- (ΧΘΕΣ: 75,21 εκατ.)
- ΣΕ ΠΑΚΕΤΑ: 12,64 εκατ. (ΧΘΕΣ: 10,43 εκατ.)
- ΔΤΡ: – 2,38% στις 893,60 μονάδες με τζίρο 20 εκατ. (ΧΘΕΣ: +1,03% στις 915,36 και τζίρος 31,56 εκατ.ευρώ)
- ΓΔ: -0,34% στις 890,37 με τζίρο 73,43 εκατ. ευρώ. (ΧΘΕΣ: +0,57% στις 893,37 και τζίρος 73,25 εκατ.ευρώ)
- 25άρης: -0,66% στις 2218,09 και τζίρος 70,70 εκατ. ευρώ. (ΧΘΕΣ: 25άρης: +0,42% στις 2232,79 και τζίρος 70,39 εκατ. ευρώ).
- ΞΕΧΩΡΙΣΑΝ ΙΔΙΑΙΤΕΡΑ: ΟΤΕ, ΠΕΤΡΟ, ΒΥΤΕ, ΦΙΕΡ, ΙΚΤΙΝΟΣ…
- ΥΣΤΕΡΗΣΑΝ: ΑΣΚΟ, ΣΠΥΡΟΥ, ΚΤΗΛΑ, ΑΛΜΥ, ΑΛΦΑ, ΦΡΛΚ, ΟΛΘ
- ΑΠΟΓΟΗΤΕΥΣΗ ΔΙΑΡΚΕΙΑΣ από τις : ΠΛΑΙΣΙΟ, MIG, CENER.
- ΠΡΟΣΟΧΗ σε: ΙΝΛΟΤ (παίκτες) και KYΡΙΟ (μεσοπρόθεσμοι, παρατράβηξε το καλαμπούρι)
ΚΡΑΤΙΚΑ ΟΜΟΛΟΓΑ

- SPREADS
| ΧΩΡΑ | ΑΠΟΔΟΣΗ % | Spread vs BUND |
|---|---|---|
| ΕΛΛΑΔΑ | 1,40 | +1,76 |
| ΠΟΡΤΟΓΑΛΙΑ | 0,38 | +0,74 |
| ΙΣΠΑΝΙΑ | 0,42 | +0,78 |
| ΙΤΑΛΙΑ | 1,30 | +1,65 |
- ΠΑΚΕΤΑ ΗΜΕΡΑΣ

- ΜΕΓΑΛΥΤΕΡΗ ΑΝΟΔΟΣ
| ΣΥΜΒΟΛΟ | ΤΙΜΗ | ΜΕΤ.% | ΔΙΑΦ. | ΟΓΚΟΣ |
|---|---|---|---|---|
| ΠΕΤΡΟ – Οι δικοί του τιμονιέρησες είναι από άλλο μέταλλο φτιαγμένοι! | 7,3000 | 8,15 % | 0,5500 | 2.281 |
| ΑΚΡΙΤ – Σε δουλειά να βρισκόμαστε… | 0,5000 | 5,49 % | 0,0260 | 1.590 |
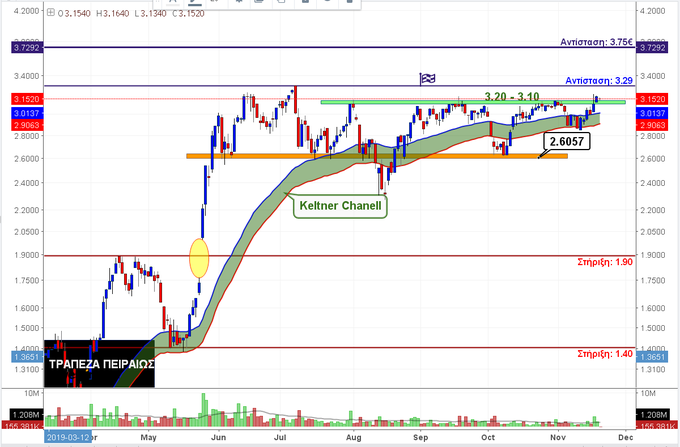
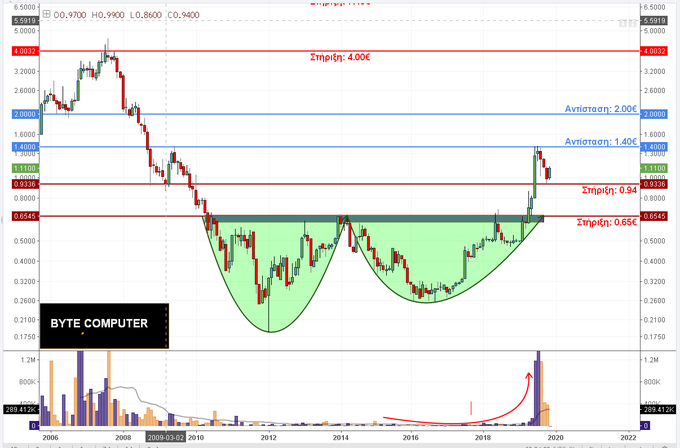
| ΒΥΤΕ – Λογική επάνοδος μετά από προηγηθθέν τσάκισμα (από 1,4000 στα 0,9500) | 1,1700 | 5,41 % | 0,0600 | 89.151 |
| ΧΑΙΔΕ – ΚΡΙΜΑ, απαράδεκτοι οι μεγαλομέτοχοι για 10ετίες | 0,7250 | 4,32 % | 0,0300 | 20 |
| ΦΙΕΡ – ΑΠΑΙΧΤΟΙ οι δικοί της παίκτες | 0,6200 | 4,20 % | 0,0250 | 24.676 |
| ΟΤΕ – ΑΝΤΑ ΚΑΙ ΑΡΙΣΤΑ 20 | 13,9200 | 3,11 % | 0,4200 | 1.927.082 |
| ΙΚΤΙΝ – Επίδειξη δύναμης στο ταμπλό. | 1,0740 | 2,87 % | 0,0300 | 173.104 |
| ΜΕΡΚΟ – ΠΕ΅ΡΑΣΕ ΣΤΟ ΠΑΝΘΕΟΝ ΤΗΣ ΙΣΤΟΡΙΑΣ ΤΟΥ ΧΑ – ΑΝΕΠΑΝΑΛΗΠΤΗ ΕΤΑΙΡΕΙΑ ΚΑΙ ΜΕΤΟΧΗ ΠΟΥ ΣΑΣ ΤΗΝ ΠΡΩΤΟΠΑΡΟΥΣΙΑΣΕ ο μ/μ στον πάτο της!! και ο ΑΝ-αλήτης!! | 53,0000 | 2,71 % | 1,4000 | 11 |
| ΣΠΙ – Πολεμιστές | 0,3500 | 2,34 % | 0,0080 | 8.590 |
| ΙΑΤΡ – Κάποια στιγμή θα… χαθεί το τόπι. ξεκίνησε την αντεπίθεση από τα 0,1800 – 0,2000!!!! Αλλά έχει κατακάψει κόσμο και κοσμάκη… | 2,2700 | 2,25 % | 0,0500 | 12.768 |
| ΙΝΛΟΤ – ΑΝΤΕ να την δούμε με συμπάθεια, αφού έχουμε πικράνει πολλούς φίλους, παίκτες της μετοχής που είναι πολεμιστές – λάτρεις του ακραίου τζόγου. Μήπως και το αντικείμενο της με τον τζόγο δεν είναι; | 0,4050 | 2,14 % | 0,0085 | 343.202 |
| ΤΡΑΣΤΟΡ- Μετά φθοράς και αφθαρσίας, έχει βγάλει όμως γερή κίνηση | 1,0400 | 1,96 % | 0,0200 | 2.931 |
- ΜΕΓΑΛΥΤΕΡΟΣ ΟΓΚΟΣ
| ΣΥΜΒΟΛΟ | ΤΙΜΗ | ΜΕΤ.% | ΟΓΚΟΣ | ΤΖΙΡΟΣ |
|---|---|---|---|---|
| ΕΥΡΩΒ – Οσο νάναι στεναχωριέσαι όταν βλέπεις τζίρο 4,7 εκατ. (και μάλιστα σήμερα ήταν ιδιαίτερα πεσμένος) σε ένα τραπεζικό χαρτί… Ο ΟΡΙΣΜΟΣ ΤΗΣ… ΜΑΖΟΧΑΣ!!! | 0,9650 | -2,03 % | 4.833.639 | 4,69εκ. |
| ΑΛΦΑ Οσο νάναι στεναχωριέσαι όταν βλέπεις τζίρο 6,5 εκατ. (και μάλιστα σήμερα ήταν ιδιαίτερα πεσμένος) σε ένα τραπεζικό χαρτί… Ο ΟΡΙΣΜΟΣ ΤΗΣ… ΜΑΖΟΧΑΣ!!! | 1,8500 | -2,94 % | 3.442.178 | 6,46εκ. |
| ΟΤΕ – ΜΙΑ ΟΜΑΔΑ ΜΟΝΟΣ ΤΟΥ!!! | 13,9200 | 3,11 % | 1.927.082 | 26,60εκ. |
| ΕΤΕ Οσο νάναι στεναχωριέσαι όταν βλέπεις τζίρο 5,4 εκατ. (και μάλιστα σήμερα ήταν ιδιαίτερα πεσμένος) σε ένα τραπεζικό χαρτί… Ο ΟΡΙΣΜΟΣ ΤΗΣ… ΜΑΖΟΧΑΣ!!! | 3,0600 | -2,24 % | 1.767.019 | 5,43εκ. |
| ΜΙΓ – “ΨΟΦΙΟ” ΧΑΡΤΙ, ντροπή για το ΧΑ – εξαφάνισαν τα δισ. των δισ. ευρώ!!! ΟΜΩΣ ΔΙΝΕΙ ΨΩΜΙ σε ΧΙΛΙΑΔΕΣ ΟΙΚΟΓΕΝΕΙΕΣ. | 0,0984 | -1,60 % | 1.354.934 | 134,7χιλ. |
| ΠΕΙΡ Οσο νάναι στεναχωριέσαι όταν βλέπεις τζίρο 3,4 εκατ. (και μάλιστα σήμερα ήταν ιδιαίτερα πεσμένος) σε ένα τραπεζικό χαρτί… Ο ΟΡΙΣΜΟΣ ΤΗΣ… ΜΑΖΟΧΑΣ!!! | 3,1100 | -2,08 % | 1.076.424 | 3,38εκ. |
| ΟΠΑΠ – ΑΡΧΟΝΤΑΣ | 9,9000 | 0,87 % | 842.211 | 8,32εκ. |
| ΕΛΛΑΚΤΩΡ – ΘΕΣΜΙΚΕΣ ΡΕΥΣΤΟΠΟΙΗΣΕΙΣ ΔΙΑΡΚΕΙΑΣ | 1,7400 | -0,11 % | 596.550 | 1,04εκ. |
| ΙΝΛΟΤ — ΤΡΩΝΕ ΨΩΜΙ ΧΙΛΙΑΔΕΣ ΟΙΚΟΓΕΝΕΙΕΣ | 0,4050 | 2,14 % | 343.202 | 137,9χιλ. |
| ΔΕΗ — ΔΕΝ ΤΕΛΕΙΩΣΕ | 3,1500 | -1,25 % | 263.486 | 833,1χιλ. |
| ΑΤΤ — ΕΞΑΙΡΕΤΙΚΗ ΕΦΕΤΟΣ | 0,4370 | 0,34 % | 196.916 | 85.441 |
| ΙΚΤΙΝ — ΔΥΝΑΜΗ | 1,0740 | 2,87 % | 173.104 | 180,9χιλ. |
- ΜΕΓ. ΕΜΠΟΡΕΥΣΙΜΟΤΗΤΑ
| ΣΥΜΒΟΛΟ | ΤΙΜΗ | ΜΕΤ.% | ΟΓΚΟΣ | ΕΜΠΟΡ. |
|---|---|---|---|---|
| ΜΛΣ – ΜΑΚΑΡΙ ΝΑ ΤΑ ΚΑΤΑΦΕΡΕΙ | 1,6600 | 0,00 % | 145.140 | 1,17 % |
| ΒΥΤΕ – | 1,1700 | 5,41 % | 89.151 | 0,56 % |
| ΟΤΕ – | 13,9200 | 3,11 % | 1.927.082 | 0,40 % |
| ΕΚΤΕΡ: ΚΤΙΖΕΙ ΒΑΣΗ | 1,3000 | 1,17 % | 43.280 | 0,38 % |
| ΑΣΚΟ: ΠΑΚΕΤΟ ΧΘΕΣ, ΠΤΩΣΗ ΣΗΜΕΡΑ | 2,9200 | -5,50 % | 45.005 | 0,34 % |
| ΕΛΛΑΚΤΩΡ – | 1,7400 | -0,11 % | 596.550 | 0,28 % |
| ΟΠΑΠ – | 9,9000 | 0,87 % | 842.211 | 0,26 % |
| ΠΕΙΡ – | 3,1100 | -2,08 % | 1.076.424 | 0,25 % |
| ΦΙΕΡ – | 0,6200 | 4,20 % | 24.676 | 0,24 % |
| ΒΙΟΣΚ – ΜΠΡΑΒΟ ΤΗΣ | 0,3970 | 0,00 % | 37.610 | 0,24 % |
| ΑΛΦΑ – | 1,8500 | -2,94 % | 3.442.178 | 0,22 % |
| ΙΝΛΟΤ – | 0,4050 | 2,14 % | 343.202 | 0,22 % |
- ΜΕΓΑΛΥΤΕΡΗ ΠΤΩΣΗ
| ΣΥΜΒΟΛΟ | ΤΙΜΗ | ΜΕΤ.% | ΔΙΑΦ. | ΟΓΚΟΣ |
|---|---|---|---|---|
| ΑΝΕΚ – ΚΑΚΟΙ ΣΧΕΔΙΑΣΜΟΙ – ΔΕΝ ΒΓΗΚΑΝ ΣΤΟ ΕΛΑΧΙΣΤΟ – ΚΑΙ ΗΡΘΕ Η ΑΠΟΛΥΤΗ ΚΑΤΡΑΚΥΛΑ | 0,0535 | -8,55 % | -0,0050 | 4.812 |
| ΦΟΥΝΤΛ – Πάμε πιο κάτω | 0,5000 | -6,54 % | -0,0350 | 1.000 |
| ΠΠΑΚ – ΕΚΠΛΗΚΤΙΚΗ ΜΕΤΟΧΗ- ΧΑΡΙΣΕ ΦΑΝΤΑΣΤΙΚΕΣ ΑΠΟΔΟΣΕΙΣ και μάλστα στην πιο μαύρη περίοδο του ΧΑ | 5,0500 | -5,61 % | -0,3000 | 29 |
| ΑΣΚΟ – | 2,9200 | -5,50 % | -0,1700 | 45.005 |
| ΕΠΙΛΚ – ΠΟΛΕΜΙΣΤΡΙΑ ΣΤΟ ΤΑΜΠΛΟ , να τα βλέπουν κάποιοι άλλοι του κλάδου της | 0,2800 | -4,11 % | -0,0120 | 49.898 |
| ΜΠΤΚ – Λεβέντης ο κ. Μπήτρος, δεν του βγήκαν τα πλάνα… Timing γαρ, το παν… | 0,1540 | -3,75 % | -0,0060 | 1.500 |
| ΣΠΥΡ – έπεσαν οι τόνοι | 0,2100 | -3,67 % | -0,0080 | 5.200 |
| ΚΤΗΛΑ – υποφέρει από εμπορευσιμότητα και όχι μόνον | 1,3900 | -3,47 % | -0,0500 | 1.200 |
| ΑΛΜΥ – πάμε παρακάτω | 1,1200 | -3,45 % | -0,0400 | 9.291 |
| ΠΕΡΦ – Η επόμενη ΠΡΟΦ, θα πάρει καιρό, αλλά…. | 3,5400 | -3,28 % | -0,1200 | 3.667 |
| ΦΟΡΘ — Μην ασχολείσθε… | 0,4160 | -3,26 % | -0,0140 | 6.220 |
| ΦΡΙΓΟ — Παρομοίως… | 0,1920 | -3,03 % | -0,0060 | 146.242 |
- ΜΕΓΑΛΥΤΕΡΟΣ ΤΖΙΡΟΣ
| ΣΥΜΒΟΛΟ | ΤΙΜΗ | ΜΕΤ.% | ΟΓΚΟΣ | ΤΖΙΡΟΣ |
|---|---|---|---|---|
| ΟΤΕ | 13,9200 | 3,11 % | 1.927.082 | 26,60εκ. |
| ΟΠΑΠ | 9,9000 | 0,87 % | 842.211 | 8,32εκ. |
| ΑΛΦΑ Οσο νάναι στεναχωριέσαι όταν βλέπεις τζίρο 3,4 εκατ. (και μάλιστα σήμερα ήταν ιδιαίτερα πεσμένος) σε ένα τραπεζικό χαρτί… Ο ΟΡΙΣΜΟΣ ΤΗΣ… ΜΑΖΟΧΑΣ!!! | 1,8500 | -2,94 % | 3.442.178 | 6,46εκ. |
| ΕΤΕ Οσο νάναι στεναχωριέσαι όταν βλέπεις τζίρο 3,4 εκατ. (και μάλιστα σήμερα ήταν ιδιαίτερα πεσμένος) σε ένα τραπεζικό χαρτί… Ο ΟΡΙΣΜΟΣ ΤΗΣ… ΜΑΖΟΧΑΣ!!! | 3,0600 | -2,24 % | 1.767.019 | 5,43εκ. |
| ΕΥΡΩΒ Οσο νάναι στεναχωριέσαι όταν βλέπεις τζίρο 3,4 εκατ. (και μάλιστα σήμερα ήταν ιδιαίτερα πεσμένος) σε ένα τραπεζικό χαρτί… Ο ΟΡΙΣΜΟΣ ΤΗΣ… ΜΑΖΟΧΑΣ!!! | 0,9650 | -2,03 % | 4.833.639 | 4,69εκ. |
| ΠΕΙΡ Οσο νάναι στεναχωριέσαι όταν βλέπεις τζίρο 3,4 εκατ. (και μάλιστα σήμερα ήταν ιδιαίτερα πεσμένος) σε ένα τραπεζικό χαρτί… Ο ΟΡΙΣΜΟΣ ΤΗΣ… ΜΑΖΟΧΑΣ!!! | 3,1100 | -2,08 % | 1.076.424 | 3,38εκ. |
| ΕΕΕ – ΚΑΤΙ ΣΥΝΕΧΩΣ ΑΠΟ ΤΗΝ ΛΑΜΨΗ ΤΗΣ | 28,0000 | -1,72 % | 119.068 | 3,35εκ. |
| ΜΠΕΛΑ – Η ΒΑΣΙΛΙΣΣΑ ΤΟΥ ΧΑ | 18,5000 | -0,43 % | 145.154 | 2,69εκ. |
| ΜΟΗ – Η ΠΡΙΓΚΙΠΕΣΣΑ | 21,7800 | -0,27 % | 88.139 | 1,91εκ. |
| ΜΥΤΙΛ – Η ΑΔΥΝΑΜΙΑ ΜΑΣ | 9,8500 | -0,61 % | 158.673 | 1,57εκ. |
| ΛΑΜΔΑ – ΜΕ ΤΟΣΟ ΣΤΡΑΤΟ, ΠΕΖΙΚΟ, ΑΕΡΟΠΟΡΙΑ ΛΟΓΙΚΟ ΕΠΑΚΟΛΟΥΘΟ… Κι αν τα βρουν δύσκολα θα φωνάξουν και το ΝΑΥΤΙΚΟ, εν ανάγκη θα ξαναθυμηθούν το ΙΠΠΙΚΟ | 7,9000 | 1,54 % | 159.953 | 1,25εκ. |
| ΕΛΛΑΚΤΩΡ – Βγάζουν πράμα συνεχείας οι Θεσμικοί… | 1,7400 | -0,11 % | 596.550 | 1,04εκ. |
- ΜΕΓΑΛΥΤΕΡΗ ΔΙΑΚΥΜΑΝΣΗ
| ΣΥΜΒΟΛΟ | ΤΙΜΗ | ΜΕΤ.% | ΟΓΚΟΣ | ΔΙΑΚ. |
|---|---|---|---|---|
| ΠΑΙΡ – κάποιος τον νοιάζεται και χαράς το κουράγιο του | 0,3600 | 0,56 % | 1.843 | 28,49 % |
| ΦΙΕΡ – Τα έχουν χαζέψει τα ζηλόφθονα παιζάκια που ειρωνευόντουσαν τον μ/μ. Λες και απευθύνονταν σε αυτούς… | 0,6200 | 4,20 % | 24.676 | 12,61 % |
| ΜΠΤΚ – | 0,1540 | -3,75 % | 1.500 | 11,25 % |
| ΜΛΣ – | 1,6600 | 0,00 % | 145.140 | 9,94 % |
| ΠΕΡΦ – | 3,5400 | -3,28 % | 3.667 | 9,84 % |
| ΑΝΕΚ – | 0,0535 | -8,55 % | 4.812 | 9,40 % |
| ΠΕΤΡΟ – | 7,3000 | 8,15 % | 2.281 | 8,89 % |
| ΕΛΒΕ – | 4,4400 | -1,33 % | 47 | 8,44 % |
| ΚΟΡΔΕ – ΜΠΛΕΞΑΜΕ ΕΔΩ… | 0,4000 | 0,50 % | 21.860 | 7,54 % |
| ΒΥΤΕ – Η ΕΠΑΝΑΦΟΡΑ… | 1,1700 | 5,41 % | 89.151 | 7,21 % |
| ΤΖΚΑ – Παληκάρι με 4πλασιασμό εφέτος | 3,9800 | 1,53 % | 915 | 7,14 % |
| ΣΑΤΟΚ – Πως τα καταφέρνουν πάντα οι μεγαλομέτοχοι της και πάντα για την πάρτη τους βρε παιδιά… Σαν άτομα μάλιστα είναι πολύ καλά, αλλά δεν τόχουν το ΝΑΚ της επιτυχίας… | 0,0290 | 0,00 % | 5.300 | 6,90 % |
_________________________
(2) 2:00μμ To χρηματιστηριακό σημειωματάριο του μικρομέτοχου- Του χάρακα το κάγκελο (20/11)

ΣΑΡΑΝΤΗΣ + ΚΡΙ ΚΡΙ – ΗΛΙΑΣ ΖΑΧΑΡΑΚΗΣ: Εταιρίες που ελληνικά θεσμικά χαρτοφυλάκια έχουν στην κατοχή τους και πιθανότατα να θελήσουν μέχρι τέλος του χρόνου να γράψουν αποδόσεις.


****
****
Απ.ΜΑΝΘΟΣ: Όποτε γίνεται Τραπεζοπανήγυρη τα μικρομεσαία είναι εκτός μόδας με πολύ λίγες εξαιρέσεις.Το θέμα είναι να μη κουραστούν απο το πολύ “χορό” και αρχίζουν και γράφουν αρνητικά πρόσημα, γιατί τότε ή θα πέσουν στην αφάνεια ή θα χτυπάνε τους αγοραστές και ας είναι στο γάμο του Καραγκιόζη.

****
ΟΤΕ – ΗΛΙΑΣ ΖΑΧΑΡΑΚΗΣ: Η στήριξη και στοπ κράτησε εύκολα δίνοντας και πάλι αντίδραση. Η ζώνη του 1384 προσοχή μιας και κατοχύρωση μπορεί να δώσει συνέχιση…

25άρης – Ηλ.Ζαχ.: Βραχυπρόθεσμα το 2250 και το 2210 είναι τα δύο επίπεδα αντίστασης και στήριξης με το δεύτερο να είναι και στοπ στο intraday long σε κλείσιμο ώρας.


____________________
(1) To χρηματιστηριακό σημειωματάριο του μικρομέτοχου (20.11.2019)
In the Spotlight
– BETA SECURITIES
Greece/Economy: The Greek economy has gained a positive dynamism with economic activity growing combined with the implementation of “prudent” fiscal policies, Hellenic Fiscal Council said in its autumn report released on Tuesday. The report said that achieving a primary surplus of 3.5% of GDP this year was feasible, while the Council did not exclude a slight overachievement of the goal. It stressed that this goal was also feasible in 2020.
“This positive dynamism of the economy, however, should be intensified in the coming years. Latest signs are encouraging: Greek banks’ deposits rose more than 10 billion euros in the last few months, consumer confidence is at several-year highs, 10-year Greek state bond yields are at historic lows while three-month Treasury bills offer negative returns,” Panagiotis Korliras, president of the Council said, adding that “although economic stability and positive sentiment played a significant role in the operation of the economy, these are not enough.”
The Council noted that a 2.0% growth of the country’s real GDP in 2019 (as predicted by the Finance ministry) is slightly more optimistic compared with its own forecasts, but still feasible. The Council noted that a 2.8% growth rate predicted by the Finance ministry in 2020 was also optimistic but within accepted limits.
Greece/Economy: The government is reportedly expected to distribute some €400mn in the form of a “social dividend”, which stems from the excess primary surplus. In this context, the government is likely to announce a ‘social dividend’ upon submission of the 2020 draft budget next week. The 10-month budget execution preliminary data released on Monday, showed a primary surplus of €5.75bn against the budgeted target of €2.3bn.
Greece/Economy – GDP Forecast: Bank of Greece governor said, in an interview with state broadcaster late Monday, that he expects the economy to run between 2.4% and 2.5% in 2020, and he urged the government to continue its strategy if the fiscal targets are to be met. The government has estimated next year’s growth rate of 2.8%. Additionally, in its autumn economic forecast report EBRD expects that the Greek economy will grow by 2% this year and 2.4% in 2020.
Greece/Industrial Sales: Industrial sales growth remained in the red in September with the annual rate falling to 0.5% y-o-y on top of an 8.2% drop in the previous month, data from the National Statistics Service of ELSTAT showed. In September 2018, sales were up 10%. On a monthly basis, industrial sales firmed 12.4% in September. Sales for the domestic market slipped 1.7% while the non-domestic market revenues were up 1.7%. Mining and quarrying turnover was up 13.7% while manufacturing turnover dropped 0.6% y-o-y.
OTE: Treasury stock stands at 1.649% of share capital (7,915,595 shares).
Intralot: Total proceeds from the sale of its 20% stake in Gamenet (6mn shares) increased to €13/share (from €12.5/share initially announced) totaling €78mn vs €75mn initially announced.
PPC: The company names Mr Karakousis as Deputy CEO in charge of commercial policies, marketing and retail divisions.
NBG: NBG Insurance non-binding bids deadline extended to November 28.
Alpha Bank (9M/Q3:19 results review):
Alpha Bank posted a marginal profit of €5m coming in the quarter coming in line with our estimates. In more details:
§ Net Interest Income in Q3:19 stood at €383.2 million, down by 1.4% q-o-q, as the lower contribution from loans, due to spread pressure, and the negative effect from Bond portfolio were partly counterbalanced by the lower wholesale funding cost. On the liability side, time deposit rates in Q3:19 declined to 52bps versus 56bps in the previous quarter. Net Interest margin stood at 2.4%. Bank said that expects higher NII in Q4:19 courtesy of new loans disbursements and deposits repricing.
§ In Q3:19, net fee and commission income picked up versus Q2 and amounted to €95.6 million, up by 17.8% q-o-q or €14.4 million, primarily reflecting an increased credit card usage due to the tourist season, higher revenues from asset management and bancassurance products as well as higher other commercial banking fees mainly related to intermediation services. In 9M:19, net fee and commission income stood at €247 million, slightly up by 0.9% y-o-y, as in Q1 2018 extraordinary fees from credit cards were recorded.
§ Income from financial operations amounted to €79.9m in Q3:19, mostly attributed to gains realization from Greek Government Bonds portfolio. Other income stood at €6.5 million.
§ Recurring operating expenses for the Group continued to decline, down 2% y-o-y or €16.5m to €792.6 million, primarily as a result of lower Staff Costs due to headcount reduction, while the corresponding Cost to Income ratio stood at 55.2%. In Greece, Recurring Operating Expenses declined by 4% y-o-y to €643.2 million.
§ In 9M:19, Personnel expenses amounted to €338.4 million, down by 3.3% y-o-y due to headcount reduction. Group headcount was reduced from 11,358 in September 2018 to 11,251 employees at the end of September 2019 (-0.9% y-o-y), mainly on the back of the VSS implemented in Greek operations in 2018. In September 2019, the Bank has launched a Voluntary Separation Scheme (VSS) in its Greek operations, which is expected to lead to the gradual departure of more than 830 Employees, with an estimated annualized benefit upon full completion of circa €35 million. General expenses declined by 9.6% y-o-y to €346.9m, reflecting the transfer of rent expense of €27.8m, mostly to depreciation, following IFRS16 implementation, as well as lower NPL remedial management costs. Adjusted for the IFRS16 impact, General expenses in 9M:19 were reduced by 2.3% y-o-y.
§ NPE stock in Greece contracted by €3.3bn y-o-y or €2.1bn in Q3:19, bringing the total stock down to €19.2bn at the end of Q3:19. This mainly reflects the classification to the Held for Sale category of a selected nonperforming portfolio (Project Neptune) falling within the perimeter of designated sale transactions, in view of its expected disposal, as well as higher cash collections and increasing liquidations. Group NPE ratio at the end of September 2019 stood at 45.5%, down by circa 2.6pps q-o-q, with NPE coverage at 43.8%.
§ NPL balances in Greece also continued their negative trajectory with stock down by €1.8bn q-o-q, to €12.1bn. At the end of September 2019, Group NPL ratio stood at 30%, down from 34.1% a year ago. NPL coverage ratio stood at 67%, while total coverage including collateral stood at 119%.
§ In Q3:19, impairment losses on loans and advances stood at €261.5m, vs. €246m in the previous quarter. CoR in 9M:19 stood at 2% over gross loans. Other impairment losses stood at €3m in Q3:19.
§ At the end of September 2019, accumulated provisions for the Group amounted to €9.8bn, while for Greece stood at €8.1bn. As a result, the ratio of loan loss reserves over gross loans for the Group and Greece stood at 19.9% and 19.3%, respectively.
§ The Group’s Loan to Deposit Ratio at the end of September 2019 declined further to 100%, down from 102% at the end of Q2:19, and for Greece to 101% down from 103% at the end of June 2019.
§ Gross loans of the Group amounted to €49.1bn as of the end of September 2019, down by €2.2bn q-o-q, as a result of the classification of. €1.8bn as Held for Sale of selected loan portfolios falling within the perimeter of designated sale transactions in view of their expected disposal. As a result of the aforementioned classification, loan balances in Greece stood at €42.1bn, down by €2bn q-o-q. New loan disbursements stood at €1bn in Q3:19, primarily to sectors such as transportation, manufacturing, trade and construction. In 9M:19, new loan disbursements in Greece reached €2.5bn.
§ At the end of September 2019, Alpha Bank’s Common Equity Tier 1 (CET1) stood at €8.7bn, resulting in a CET1 ratio of 18%, up by 25 bps q-o-q, benefiting from the higher reserve of the investment securities portfolio measured at fair value through other comprehensive income (FVOCI), a positive impact from the regulatory treatment of tax losses and the utilization of the 10% DTA threshold, the quarterly earnings generation and partly counterbalanced by an increase of RWAs. fully loaded Basel III CET1 ratio stood at 15.1%. Tangible Book Value at the end of September 2019 was the highest among Greek banks, at €8bn. RWAs at the end of September 2019, amounted to €48.1bn, up by 1.1% q-o-q or €0.5bn, due to higher credit and market risk contribution.
§ Tangible Book Value per Share stood at €5.2. (P/TBV 0.37x)
The following table summarizes results vs our estimates:
|
Alpha Bank |
Act. |
Act. |
Act. |
Overview |
Est. |
|
|
|
(In Million Euro) |
3Q18 |
2Q19 |
3Q19 |
QoQ |
YoY |
3Q19 |
vs Est. |
|
NII |
426.6 |
388.6 |
383.2 |
-1.4% |
-10.2% |
382 |
0.3% |
|
Fee income |
78.9 |
81.2 |
95.6 |
17.7% |
21.2% |
88 |
8.6% |
|
Trading |
134.8 |
123.7 |
79.9 |
-35.4% |
-40.7% |
80 |
-0.2% |
|
Other Income |
8.9 |
10.9 |
6.5 |
-40.6% |
-27.3% |
8 |
– |
|
Total income |
649.2 |
604.4 |
565.1 |
-6.5% |
-13.0% |
558 |
1.3% |
|
Operating costs |
-275.4 |
-281.7 |
-280.0 |
0.6% |
-1.7% |
-277 |
-1.1% |
|
Pre-provision-profits |
373.8 |
322.7 |
285.2 |
-11.6% |
-23.7% |
281 |
1.5% |
|
Provisions |
-294.6 |
-246.0 |
-261.5 |
-6.3% |
11.2% |
-260 |
-0.6% |
|
Other results |
-19 |
-9 |
-3.0 |
64.6% |
|
-5 |
|
|
PBT |
60.2 |
68.1 |
20.6 |
-69.7% |
-65.8% |
16 |
28.9% |
|
Corporate taxes |
19.2 |
8.7 |
15.9 |
83.3% |
-16.9% |
10 |
59.5% |
|
Net profit (continued) |
41 |
59 |
5 |
-92.1% |
-88.6% |
6 |
-22.2% |
|
Discontinued operations |
0 |
0 |
0.0 |
|
|
0 |
|
|
Net profit |
40.0 |
59.4 |
4.7 |
-92.1% |
-88.3% |
6 |
-22.2% |
- Alpha Bank Strategy Update 2020 – 2022
§ Alpha Bank’s main priority is to accelerate the de-risking of its balance sheet, as a high CoR has been the principle factor undermining profitability in the past years. Alpha Bank will undertake a non-dilutive large-scale NPE securitization of a mixed portfolio, with total on-balance sheet gross book value of up to €12bn (“Project Galaxy”). Alpha Bank intends to use up to €3.7bn of guarantees under the recently approved Hellenic Asset Protection Scheme (HAPS) upon its enactment through legislation by the Greek Government. This transaction will be accompanied by a carve- out of the Bank’s NPE management platform to Cepal Hellas and the sale of New Cepal to investors participating in the Project Galaxy process. As a result of these transactions, Alpha Bank’s NPE ratio in the Bank’s Greek operations is expected to decrease from 44.1% to less than 20% by year-end 2020, with the corresponding NPL ratio at below 10%, and CoR is expected to normalize at <100bps pro-forma for the Galaxy transaction.
§ Following the completion of Project Galaxy, Alpha Bank will further reduce its “core” NPE book, predominantly through restructuring and reperformance strategies, resulting in an NPL and NPE ratio of less than 5% and 10% respectively in the Bank’s Greek operations by the end of 2022. Alpha Bank will maintain its comfortable capital buffers throughout the execution of the NPE Plan, in-line with regulatory expectations, and targets a CAD ratio of approximately 17% at the end of 2022.
§ The acceleration of the NPE Plan will be enabled through the spin-off and hive-down of Alpha Bank’s banking operations into a wholly owned banking subsidiary of the listed entity, which will subsequently become a holding company, all shareholders’ rights being preserved throughout the process as per applicable legislation.
§ Alpha Bank will transform its operating model to achieve a Cost-to-Income ratio of lower than 48%, with the Cost-to-Assets ratio decreasing to less than 145bps. The Bank will aim to decrease its recurring cost base by more than 10%, bringing operating expenses to approximately €960m, down from €1.1bn in 2018.
§ The bank aims to disburse €14bn of loans between 2019 and 2022 in its Greek operations, with €11bn being disbursed in the next 3 years, while annual fee and commission revenue is targeted to increase by approximately €110m overall, driven by new lending and transaction banking activity as well as the accelerated growth in investment and bancassurance products penetration.
§ That said Alpha is targeting a 9% ROTE in 2022 with a potential 10% pay out in 2021 subject to SSM approval.
Key financial targets for 2022
§ NPE ratio of <10% and NPL ratio of <5% in Greece
§ Cost of Risk of <70bps in 2022
§ Capital position with an envisaged 2022 CAD ratio of ~17% and a CET1 ~15%, well above regulatory expectations.
§ Cost to Income ratio below 48% and Cost to Assets ratio of below 145bps
§ New loan disbursements of approximately €14bn in Greece for the period 2019-2022
§ Targeted Return on Equity of ~ 9.0%
Overall an ambitious plan aiming to reduce drastically NPEs and return P/L statements to a decent level of profitability. Challenges related to NPEs sales and macro trends are identified as key risks as it regards to the execution of the plan. However, this is a roadmap for Alpha Bank to return to core banking operations and a benchmark to measure performance.
Ellaktor (Results 9M:19):
Ellaktor announced 9M:19 results yesterday posting net losses of 24.9m. A conference call will follow today at 16:30 GR-Time. Revenues dropped by 26.4% to €1,016.2m, mostly as a result of decreased revenues in Construction (€718.2m vs €1,090.6m in 9M:18) while EBITDA amounted to €151.2m (vs €59.8 m in 9M:18). PBT amounted to €31.1m vs losses of €77.4m in 9M:18). Results are not comparable as the Group recorded one-off losses of c€160m in 9M:18 related to construction business (€150m) and Concessions (€10m) reflected in Group’s EBITDA. As per segment:
§ Construction segment: Turnover dropped to €718.2m compared to €1,090.6m in the corresponding period of 2018. In terms of operating results, operating losses were limited to €31.1m versus losses of €113.6m in 9M:18 and are due to a total loss of €46.5m from the construction of PV parks in Australia. At the level of earnings before tax (EBT) for 9M2019, the segment recorded losses of €35.6m, compared to losses of €130.4m in the corresponding period of 2018, while results after tax in the Construction segment stood at losses of €42.9m versus losses of €131.7m in 9M2018. The construction backlog of AKTOR and its subsidiaries at 30.09.2019 stood at €1.3bn, while contracts of 0.8bn (in Greece and abroad) are expected to be signed, setting the total value of AKTOR’s projects’ portfolio at €2.1bn.
§ Concessions Segment: Turnover amounted to €179.3m marginally reduced compared to the €179.9m of the nine months results of 2018, mainly due to not including EPADYM’S results, a subsidiary that was sold to HELECTOR within the nine months of 2019, as well as due to the reduced turnover of ATTIKES DIADROMES from the EGNATIA ODOS project because of the decreased construction revenue from new toll stations. Increased traffic volumes in mature concessions continued in the nine months of 2019. More specifically, traffic volume increased by 4.4% in ATTIKI ODOS, by 6.2% in GEFYRA, by 5.1% in OLYMPIA ODOS and by 6.5% in AEGEAN MOTORWAY in the corresponding period of 2018. Operating results increased by 28.2%, amounting to €77.6m versus €60.5m in the 9M 2018, which included though a negative impact from a €10m non-recurring provision for impairment of withholding tax on dividends receivable. Earnings before tax stood at €54.5m, compared to €38.4m, increased by 41.9% and profits after tax stood at €33.3m versus €23.7m in the 9M of 2018, increased by 40.8%.
§ Environment Segment: Turnover amounted to €64.7m, compared to €63.3m in the corresponding period of 2018, increased by 2.2%. Operating results were profits of €2.5m versus profits of €18.1m in the nine months of 2018, which included though a non-recurring profit of €4.2m (due to an old provision reversal due to settlement), as well as reparations of €5.8m by EDSNA regarding non-contractualized services. It is noted that the 9M 2019 results have been affected, among others, by decreased inbound quantities in waste management units and increased needs for heavy maintenance in the Osnabruck plant, which led to decreased output. It is also noted that depreciations were also increased due to the partial replacement of electromechanical equipment and depreciations of newly acquired subsidiaries. For the nine months of 2019, the results before tax were profits of €3.2m compared to profits of €18.7m in the corresponding period of 2018, while the results after tax were profits of €1.1m compared to profits of €13.6m in the 9M of 2018.
§ Renewables Segment (RES): Turnover of the Renewables Segment amounted to €49.0m vs. €42.7m in the corresponding period of 2018, noting a 14.6% increase. Operating results presented profits of €28.7m versus €23.0m in 9M:18, increased by 24.7%. The EBIT margin 9 stood at 58.6%. Earnings before tax rose to €21.2m vs. €14.5m in 9M:18, increased by 46.6% and profits after tax rose to €17.4m versus €10.6m in the corresponding period of 2018, increased by 65.1%. Electricity production in the 9M of 2019 amounted to 537.9 GWh, increased by 13% compared to the respective period of 2018, mainly due to the combination of increased installed capacity (6.4%) and more favourable weather conditions (6.6%). The total installed capacity of the RES segment amounted to 296 MW on 30.09.2019. Five wind parks of 195.6 MW installed capacity are in the final stage of construction and two additional wind parks of 88.2 MW installed capacity are in the initial stages of construction. Finally, new RES projects (mainly Wind Parks) of 283.54 MW are in various stages of development.
§ Real Estate Segment: The Group’s Real Estate Segment recorded a turnover of €4.8m vs. €4.9m in the corresponding period of 2018. Operating results were profits of €0.4m, versus profits of €0.7m for the 9M 2018. The results before tax were losses of €0.5m compared to losses of also €0.5m in the nine months of 2018 and results after tax were losses of €1.6m compared to losses of €0.9m in the corresponding period of 2018. Recently, (after 30.09.2019) REDS completed the Phase B Development of SMART PARK, the retail park that now spans across a total area of 53,000sq.m., previously at 35,000sq.m., while the lease coverage ratio in the new premises already exceeds 80%. The expansion of the SMART PARK is estimated to further enhance its growth, already evident in the 2019 data, according to which there is 5.8% increase of footfall within the first 9 months of 2019 versus 2018, 9.7% increase in total sales of Smart Park’s stores and 8.5% increase in comparable sales (Like-to-like).
§ Financial assets at fair value through other comprehensive income has increased by 62.5% to €65.8m, mainly due to the revaluation of the participation in Olympia Odos, as well as value uplift of Eldorado Gold shares.
§ Financial assets at amortized cost has decreased by 37.7% to €43.7m mainly due to the expiration of a EFSF bond.
§ Total Debt includes €490.5m of non-recourse debt relating to Attiki Odos (€26.0m vs €37.5m in 31.12.2018) and Moreas (€464.4m vs 469.3m in 31.12.2018). Operating cash flows reached (€92.2m) vs (€1.7m) in 9M:18, Cash flows from financing activities amounted to €31.8 m and include mainly loan drawdowns and repayments. Investment cash flows amounted to (€40.8m) vs (€43.6m) in 9M:18 and include capex of ~ €110m.
§ In other news the Group is reportedly seeking to issue a Eurobond.
|
ELLAKTOR |
2018 |
2019 |
Y-o-Y |
2018 |
2019 |
Y-o-Y |
|
EUR thous. |
9Μ |
9Μ |
(%) |
Q3 |
Q3 |
(%) |
|
Sales |
1,381,621 |
1,016,000 |
-26.5% |
459,284 |
310,869 |
-32.3% |
|
EBITDA |
59,846 |
151,200 |
152.6% |
-22,592 |
38,993 |
272.6% |
|
EBITDA Mrg |
4.3% |
14.9% |
+1,055 bps |
-4.9% |
12.5% |
+1,746 bps |
|
Net Income |
-125,263 |
-24,900 |
80.1% |
-79,539 |
-16,526 |
79.2% |
|
Net Mrg |
-9.1% |
-2.5% |
+662 bps |
-17.3% |
-5.3% |
+1,200 bps |
Conference call details (20/11 16:30 GR-Time)
- § GR +30 213 009 6000
- § UK +44 (0) 203 059 5872
- § US +1 516 447 5632
Fourlis (Q3/9M’19 results review):
The company reported an in line set of Q3/9M’19 results in terms of sales and EBITDA while we missed net profit estimate due to higher than expected depreciation charges as a results of the IFRS 16 implementation. Sales in 9M’19 advanced by 4.14% to €339.30mn, EBITDA came in at €44.4mn, 55.8% higher on a yearly basis while net income retreated 21.05% to €6mn vs €7.6mn in 9M’18. Capex for the period stood at €10.3mn (we project €13mn for FY’19) while Net Debt rose to €116mn vs €95mn in FY’18 (we expect Net Debt to settle at €107.3mn by year-end burdened by IKEA mother company completed special payments terms).
On the divisions segment we note IKEA Greece turnaround which advanced 0.8% in the 9M’19 period and resilient performance by IKEA SEE (Bulgaria and Cyprus operations) advancing by 5.3%. IKEA gross margin improved by 71bps at 41.72% compared to 41.01% as a results of better product mix while IKEA comparable EBITDA margin was flat y-o-y to 9.54% leading to a division EBITDA growth similar to top line ie +2.46% to €20.8mn.
The following tables summarize IKEA’s Q3/9M’19 performance:
|
Q3’19 review |
|
|
|
|
|
|
IKEA (€mn) |
Q3 2018(A) |
Q3 2019(A) |
% chng y-o-y |
Q3 2019 BETA EST |
Dev from actual |
|
Sales |
82.26 |
85.19 |
3.56% |
84.45 |
-0.87% |
|
Gross Profit |
34.15 |
36.11 |
5.75% |
35.10 |
-2.80% |
|
Gross Profit margin |
41.52% |
42.39% |
+88 bps |
41.56% |
-83 bps |
|
Comparable EBITDA |
11.48 |
11.86 |
3.34% |
12.15 |
2.39% |
|
Comparable EBITDA margin |
13.96% |
13.93% |
-3 bps |
14.38% |
+46 bps |
|
source: Company, BETA Securities Research estimates |
|
|
|
||
|
9M’19 review |
|
|
|
|
|
|
IKEA (€mn) |
9M 2018(A) |
9M 2019(A) |
% chng y-o-y |
9M 2019 BETA EST |
Dev from actual |
|
Sales |
213.10 |
218.10 |
2.35% |
217.36 |
-0.34% |
|
Gross Profit |
87.40 |
91.00 |
4.12% |
89.99 |
-1.11% |
|
Gross Profit margin |
41.01% |
41.72% |
+71 bps |
41.40% |
-32 bps |
|
Comparable EBITDA |
20.30 |
20.80 |
2.46% |
21.08 |
1.37% |
|
Comparable EBITDA margin |
9.53% |
9.54% |
+1 bps |
9.70% |
+16 bps |
|
source: Company, BETA Securities Research estimates |
|
|
|
||
Retail sporting goods division was also resilient with Greece advancing 6.1% and SEE up by 9.3% leading to an overall Intersport sales growth of 7.54% for the period to €121.20mn vs our guess for €118.9mn. Intersport gross margin was 44bps lower y-o-y to 45.8% (vs 46.23% in 9M’18 and our call for 46%) on extended summer period offers for destocking as a result of longer than anticipated summer weather conditions and 45 sales period in Q3’19. Gross margin erosion in the division also mitigated on the EBITDA level with comparable EBITDA margin deteriorating by 24bps to 7.84% bringing division’s EBITDA growth to 4.4% to €9.50mn (we were calling for a 7.7% comparable EBITDA margin and €9.2mn division EBITDA).
The following tables summarize INTERSPORT/TAF Q3/9M’19 performance:
|
Q3’19 review |
|
|
|
|
|
|
Intersport/TAF (€mn) |
Q3 2018(A) |
Q3 2019(A) |
% chng y-o-y |
Q3 2019 BETA EST |
Dev from actual |
|
Sales |
41.46 |
46.82 |
12.93% |
44.52 |
-4.92% |
|
Gross Profit |
18.96 |
20.62 |
8.74% |
19.81 |
-3.91% |
|
Gross Profit margin |
45.73% |
44.04% |
-170 bps |
44.50% |
+46 bps |
|
Comparable EBITDA |
4.57 |
4.61 |
0.79% |
4.26 |
-7.49% |
|
Comparable EBITDA margin |
11.02% |
9.84% |
-119 bps |
9.57% |
-27 bps |
|
source: Company, BETA Securities Research estimates |
|
|
|
||
|
9M’19 review |
|
|
|
|
|
|
Intersport/TAF (€mn) |
9M 2018(A) |
9M 2019(A) |
% chng y-o-y |
9M 2019 BETA EST |
Dev from actual |
|
Sales |
112.70 |
121.20 |
7.54% |
118.90 |
-1.90% |
|
Gross Profit |
52.10 |
55.50 |
6.53% |
54.69 |
-1.45% |
|
Gross Profit margin |
46.23% |
45.79% |
-44 bps |
46.00% |
+21 bps |
|
Comparable EBITDA |
9.10 |
9.50 |
4.40% |
9.16 |
-3.63% |
|
Comparable EBITDA margin |
8.07% |
7.84% |
-24 bps |
7.70% |
-14 bps |
|
source: Company, BETA Securities Research estimates |
|
|
|
||
Overall an expected set of results rendering our FY estimates feasible. FOurlis trades at a projected FY’19 P/E16.7 and EV/EBITDA 8.4x. We have an OVERWEIGHT recommendation on the stock with a TP €7.6.
The following table summarizes Fourlis Q3/9M’ financial performance:
|
FOURLIS |
2018 |
2019 |
Y-o-Y |
2019 |
Act. vs |
2018 |
2019 |
Y-o-Y |
2019 |
Act. vs |
|
EUR m. |
9Μ |
9Μ |
(%) |
9Μ est |
Est. |
Q3 |
Q3 |
(%) |
Q3 est |
Est. |
|
Sales |
325.8 |
339.4 |
4.2% |
336.3 |
0.9% |
123.7 |
132.1 |
6.8% |
129.0 |
2.4% |
|
EBITDA |
28.5 |
44.4 |
55.8% |
45.0 |
-1.2% |
15.7 |
21.2 |
34.8% |
21.7 |
-2.5% |
|
EBITDA Mrg |
8.7% |
13.1% |
+433 bps |
13.4% |
-2.1% |
12.7% |
16.0% |
+333 bps |
16.8% |
-4.8% |
|
Net Income |
7.6 |
6.0 |
-21.1% |
8.28 |
-27.5% |
7.2 |
7.1 |
-1.8% |
9.4 |
-24.3% |
|
Net Mrg |
2.3% |
1.8% |
-56 bps |
2.5% |
-28.2% |
5.8% |
5.4% |
-47 bps |
7.3% |
-26.1% |
The management will host a conference call to discuss Q1 results on Wednesday November 20th at 5pm local (GR) time. Quote: “Fourlis Group”. Dial in numbers:
- § Greek Participants 800 84 81 114
- § US participants 1877 553 9962
- § UK participants 080 823 80 669
- § International Participants +44 (0) 2071 928532

")

")
")
")